EQUATION It is a software for graphs of mathematical functions, which traces the functions, in 2D, on an X-Y Cartesian level. I planned this software when I was 15 years old: on the other hand, at the scientific high school, mathematical functions were studied. I therefore had the opportunity to combine two passions, the one for computer science and that for mathematics.

The EQUATIO mathematical function graphing software is able to plot two functions in parallel, one for each Cartesian axis. The graph is then plotted point by point.
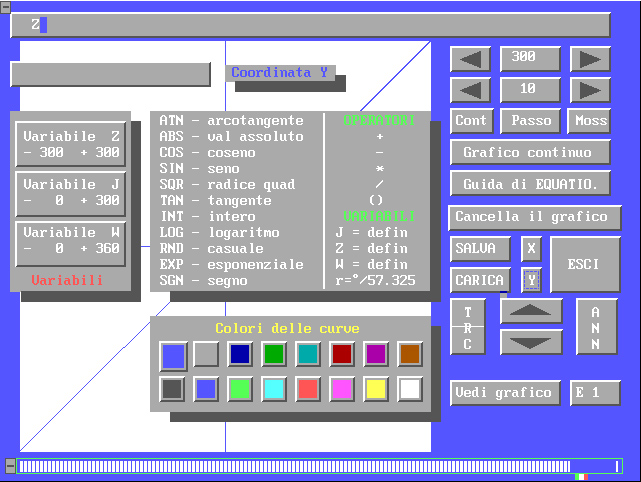
The functions available in the EQUATIO mathematical function graphing software are included in the following list:
- ATN - Arcotangent di a number;
- ABS - Absolute value of a number;
- Cos - cosine of a corner;
- Sin - breast of a corner;
- SQR - square root of a number;
- Tan - tangent of a corner;
- INT - full value of a number;
- Log - logarithm of a number;
- RND - random numbers generator;
- Exp - exponentially exponential;
- SNG - sign of a number.
The software allows you to set the color of the chart, save and upload to file all the expressions typed and also the settings.
The maximum and minimum limit of the independent variable can be set, in order to trace the graph of the function only in the section of interest. The zoom function is also available, to enlarge or reduce the view of the traced mathematical function.

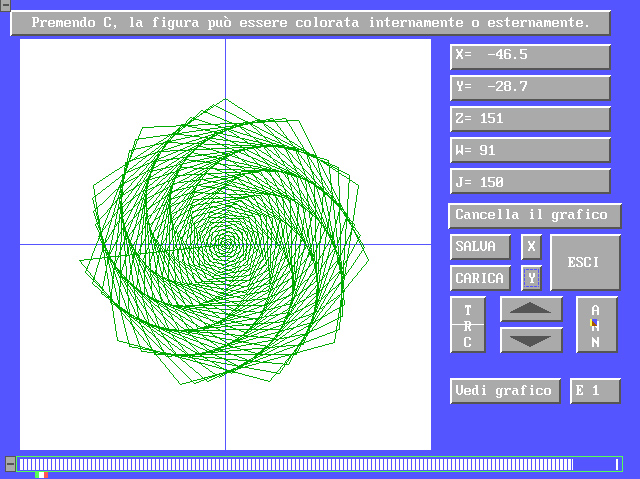
Three independent variables are available in parallel, each with its own maximum and minimum limit. In addition, there is a function to color closed areas of plotted charts.
Examples of using the software for graphs of mathematical functions EQUATIO
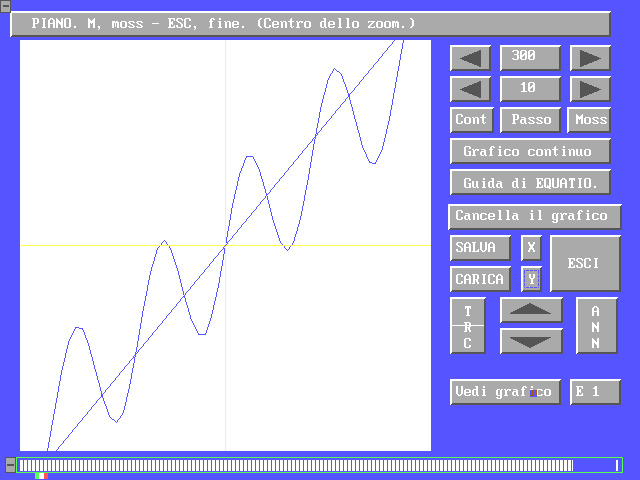
Below, here is an example of the tracking of a mathematical function on the Y axis, with a single independent variable x:
Y = sin (X) + X
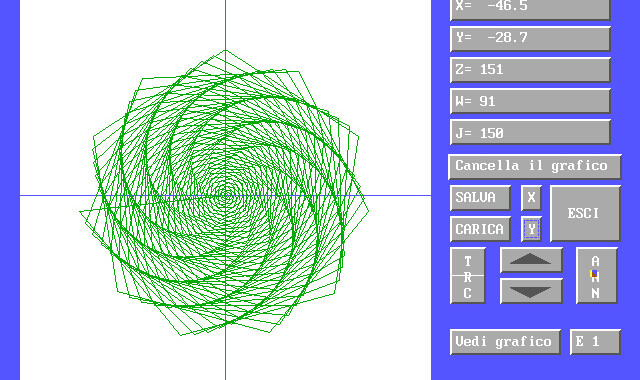
This second example is related to two mathematical functions, which share the same independent variable W, which are plotted on the two axes X and Y in parallel:
X = W * cos (W)
Y = W * sin (W)
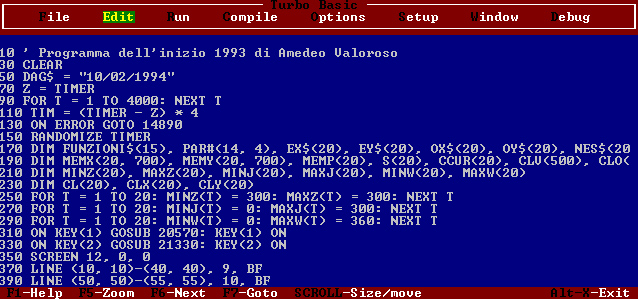
Programming language: Borland TurboBasic.
Project start: January 1993. State: for personal use.